We begin with two questions.
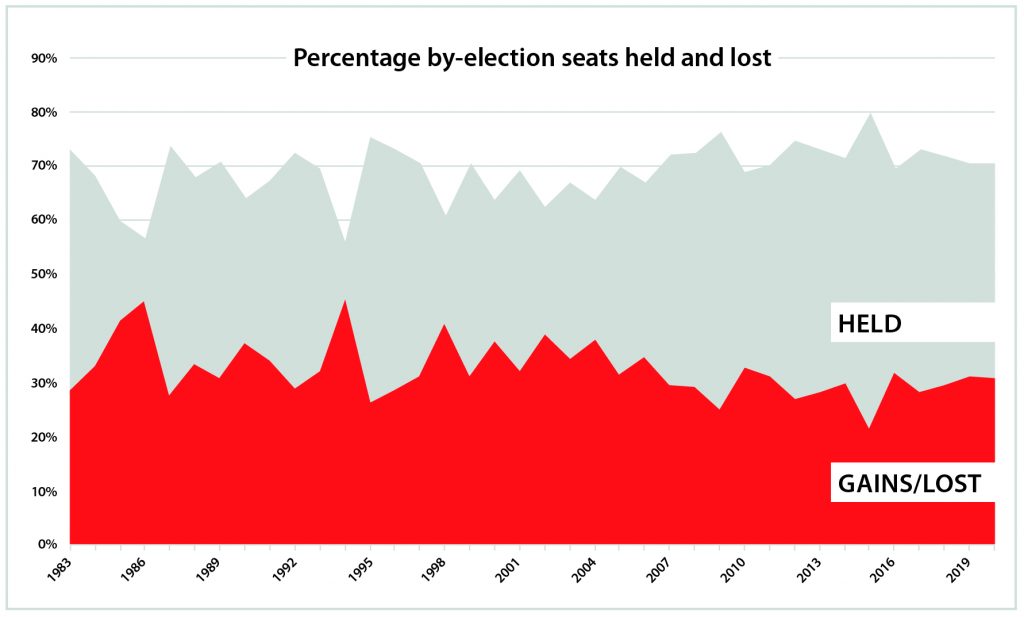
First, considering council by-elections since 1983, which year has seen the largest proportion of seats changing hands – in other words, the greatest electoral volatility? Second, which year has the smallest proportion?
In the early 1980s, we were encouraged by Cris Derby, then editor of the Local Government Chronicle, to begin writing about council by-elections. We turned to sources within political parties for our information – this was a long time before the internet.
Tony Greaves, now a Liberal Democrat member of the House of Lords, was particularly helpful in providing results and understandably enthusiastic that we write about his party.
The data was at first collected and stored on our university’s mainframe computer before we acquired an Apple IIe and VisiCalc (visible calculator) that most historians regard as the first spreadsheet program for the microprocessor. Stored on floppy discs – an unreliable technology at the best of times – a spreadsheet was limited to 254 rows.
In time we came to learn, as many party activists had learnt from bitter experience, that conventions about marginal or safe seats had little meaning in the local government context. Local parties were punished or rewarded for reasons largely beyond their control. Campaigning was deeply frustrating, with candidates harangued on the doorstep for issues and policies of no relevance to the local council.
“Making sense of it all was made easier as cases accumulated”
But some results did run against the mainstream; local personalities and issues could and did matter. Councillors who had lost their seats would re-emerge, sometimes for a different party. Parties lost against the national trend because of stances taken on planning approval for or against supermarkets, leisure centres and the like.
Making sense of it all was made easier as cases accumulated. Within six months, we had passed 100 results. By 1986, 1,000 by-elections had been collated.
We now knew how their frequency was conditional on the local electoral cycle. Seasonal factors appeared to affect turnout. Party competition mattered, especially whether it was a Liberal or a candidate from the Social Democrats who fought under the Alliance banner.
In November 2017, we passed another milestone – 10,000 by-elections. Monitoring these results provides an additional and sometimes alternative insight into the direction of electoral opinion than that available from opinion surveys.
One of the great strengths in these results is that current outcomes must be benchmarked against different points in recent history. Was the ward last contested a year ago, two years, or longer still?
And so to our answers. It was 1994 when the proportion of seats changing hands reached the peak of 45 per cent – almost one in every two vacancies.
Seasoned Conservatives will have known this, perhaps. They watched seats being lost not only to the Liberal Democrats (we described them as Social and Liberal Democrats in those days), but also later in the year to a revitalised Labour under new Leader Tony Blair.
A close second was 1986, when by-election outcomes saw a free-for-all, with parties winning seats from one another with startling regularity. We even had to contend with Liberals and SDP candidates standing separately from the Alliance, although the record shows no seats changed hands between the factions.
The ‘great yawn’, from commentators’ rather than participants’ point of view, when few seats changed hands, was more recent. In 2015, only 21 per cent of by-election seats resulted in a transfer.
The number of vacancies was low because of the large-scale council elections that year. Buoyed by their surprise General Election success, the Conservatives held seats and occasionally won them from Labour, Liberal Democrats and UKIP alike.
The nearest challenger for the least volatile election year, 2009, was relatively exciting as one in four vacancies saw the incumbent party defeated.
Labour, now under Gordon Brown, had begun to recover some lost ground; local Liberal Democrats were still fighting and winning against the party soon to be its coalition partner; and we even saw a Liberal gain from Liberal Democrat, an echo from another time.