It is nearly half a century since the last wholesale review of English local government in 1973 created a pattern of county and constituent district councils. Much has happened since then, of course.
The two-tier system was first breached in 1986 when Margaret Thatcher abolished metropolitan counties. Subsequently, the number of unitary councils has sharply increased with many districts being reorganised out of existence.
Dorset shrunk from eight councils to just two in 2019. This year, there are elections for all-purpose authorities in Buckinghamshire and Northamptonshire and a reduction of 10 in the number of councils covering those areas.
In 1973, there were 410 local authorities in England; there are now 333. Over the same period, the number of councillors, affected by both this and re-warding, is down by more than a fifth to barely 17,000.
And further mergers remain on the cards including in Cumbria and Lancashire, east and north Yorkshire, and Warwickshire.
But in the midst of change there are electoral wards and divisions whose boundaries have not altered throughout the period.
There are fewer than 200 of them in total and, by definition, they are less likely to have seen dramatic population growth or housing development and are often places in relative geographic isolation.
What they do offer, though, is a fascinating micro-level insight into how local politics can change as a result of demography, campaigning, or salient local issues.
West Thornton ward in Croydon for example – one of two in the borough and only three in the whole of London to be unchanged since 1964 – began as fairly marginal but leaning to the Conservatives.
Labour won it briefly in the 1970s, but since its 1986 victory has built support to the point where it attracted no less than 75 per cent of the vote in 2018.
The Handside ward of Welwyn Hatfield was a Conservative banker for a decade, but in the 1980s the Labour vote shrank and that for the Liberal Democrats rose – propelling them initially to second place before winning for the first time in 1986. Since then, the battle has swung between the Conservatives and Liberal Democrats with Labour nowhere.
The Conservatives had won Castle Bromwich ward in Solihull on 33 consecutive occasions and usually by a country mile. In both 2018 and 2019, however, the Greens came from nowhere to record decisive victories.
There was great media excitement in 2012 when Labour gained Chipping Norton (part of Prime Minister David Cameron’s Witney constituency) from the Conservatives. In truth though, Labour councillors had been elected for the ward at 16 out of 26 contests since 1973, and the Conservatives had not won there at all until 2000.
Several of these enduring wards will be going to the polls again in May when they will be joined by seven county divisions whose boundaries have remained unaltered since 1981.
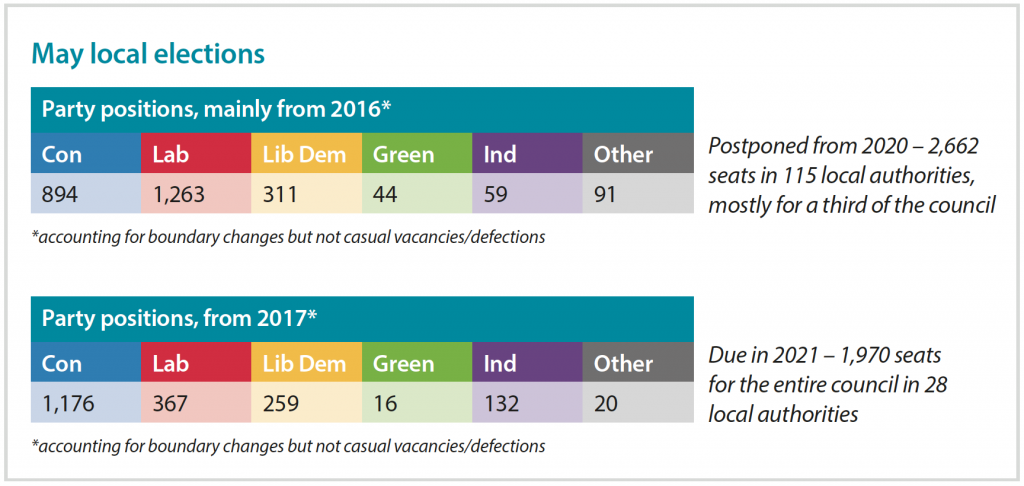
In all, more than 4,500 councillors across 143 local authorities will be chosen following the unprecedented peacetime rollover of last year’s due elections.
In the next two editions of first, we will offer a comprehensive analysis of the differing contexts against which they are taking place and argue why the results may be difficult to interpret.
